Venn diagram templates are pre-designed layouts that can be used to create Venn diagrams. These templates provide a standardized format for organizing and presenting information, making it easier to create clear and effective Venn diagrams.
Venn diagrams are a type of graphic organizer that use overlapping circles to represent and compare information. Each circle represents a set of items or ideas, and the areas where the circles overlap represent the elements that are shared by all of the sets. Venn diagrams are a visual way to represent information and can be used to compare and contrast different things, such as groups, concepts, or objects.
Venn diagram templates can be useful for a variety of purposes. For example, they can be used in education to help students organize and compare information, in business to illustrate relationships between different groups or ideas, or in research to visualize data and findings. Venn diagram templates can also save time and provide inspiration for new ways to organize and present information.
What are the different types of Venn diagram templates?
There are many different types of Venn diagram templates available, depending on the number of sets being compared and the way in which the information is organized. Some common types of Venn diagram templates include two-set diagrams, three-set diagrams, Euler diagrams, set notation diagrams, and hierarchical diagrams.
To use a Venn diagram template, simply choose the template that best fits your needs and enter the information you want to represent. The template will provide a pre-designed layout that you can use as a starting point for your Venn diagram. You can then customize the diagram by adding labels, colors, and other visual elements to make it more clear and effective.
Overall, It can be a valuable tool for organizing and presenting information. They provide a standardized format for creating Venn diagrams, which can help to ensure that the diagrams are clear and easy to understand. Whether you are a student, a teacher, a researcher, or a business professional, It can help you effectively communicate your ideas and insights.
Venn Diagram Templates
For those of who do not understand what is meant by a Venn diagram, we have provided a material related to Venn diagram – what it is, what its functions are, its elements, and also examples of the diagrams.
Definition of Venn Diagram
A Venn diagram is like a medium to express a set using images. This method was first introduced by an English mathematician, named John Venn. Venn diagram can be defined as a diagram in which there are all possible logical relationships and hypotheses from a set of objects
Elements of a Venn Diagram
A Venn diagram consists of several elements. The first element is the Universe, which is symbolized by S letter written in the upper left corner of a rectangular image. The second element is the curves. Every other set discussed (other than the empty set) is represented by a circle or a closed curve. The next element is the dots. Each member of the set is indicated by a dot and the set member is written next to the dot.
Conditions of the sets
The first condition is the intersecting set. It occurs when there are members of set A which also become the members of set B. Set A which intersects with set B can be written A∩B.
The next condition is separated. Sets A and B are said to be mutually independent if there are no members of the set A and B that are the same. Set A is separated from the set B can be written as A // B.
The third set is subsets. Set A can be said as a subset of set B if all members of set A are members of set B. If all set B’ members happen to be the same as those of set A, it will become the same set. So it can be said that set A is equal to set B. This same set can be written A = B.
Templates
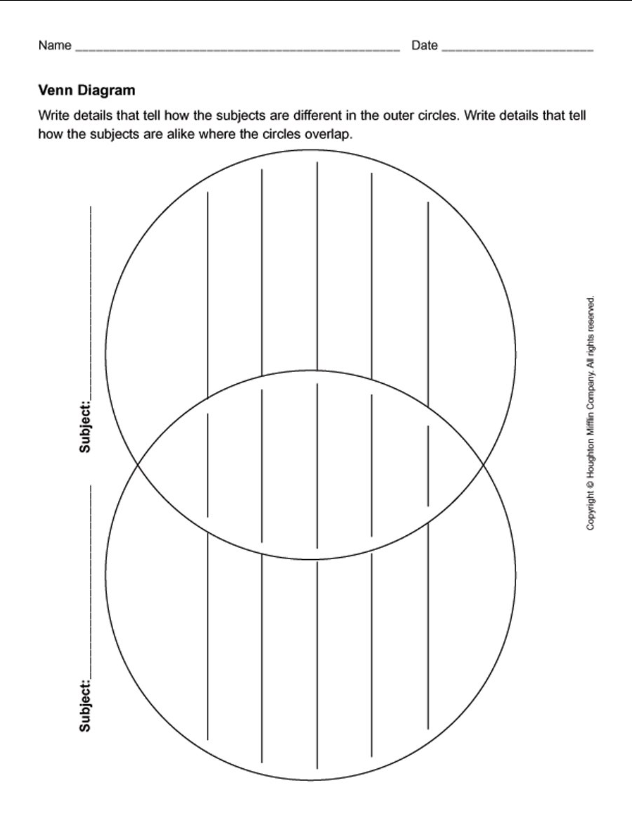
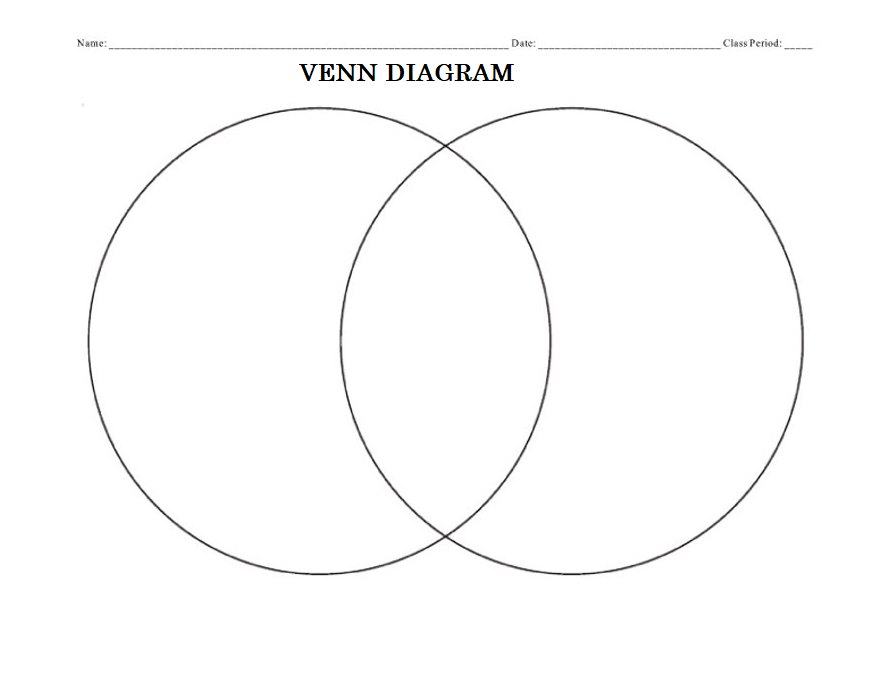
After knowing the definition, elements, and conditions that may occur in a Venn diagram, you may want to start making it yourself. But if you still find it confusing, you can take a look at the examples that we have provided. You can simply download the Venn diagram templates that we offer. The templates come with different conditions representing the intersecting, separated, and the same sets. After downloading the templates, you will find that drawing a Venn diagram is not a hard thing, actually.
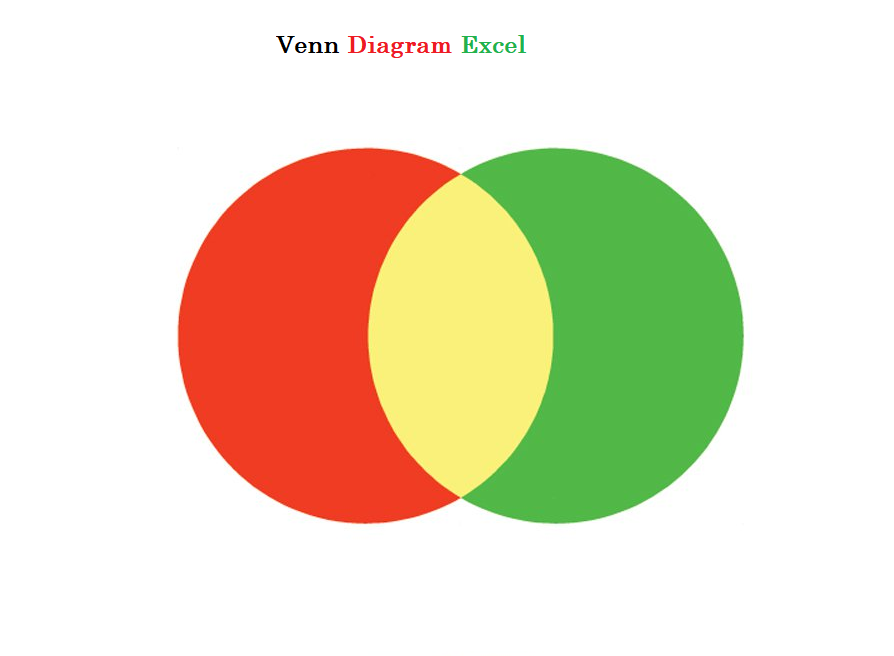
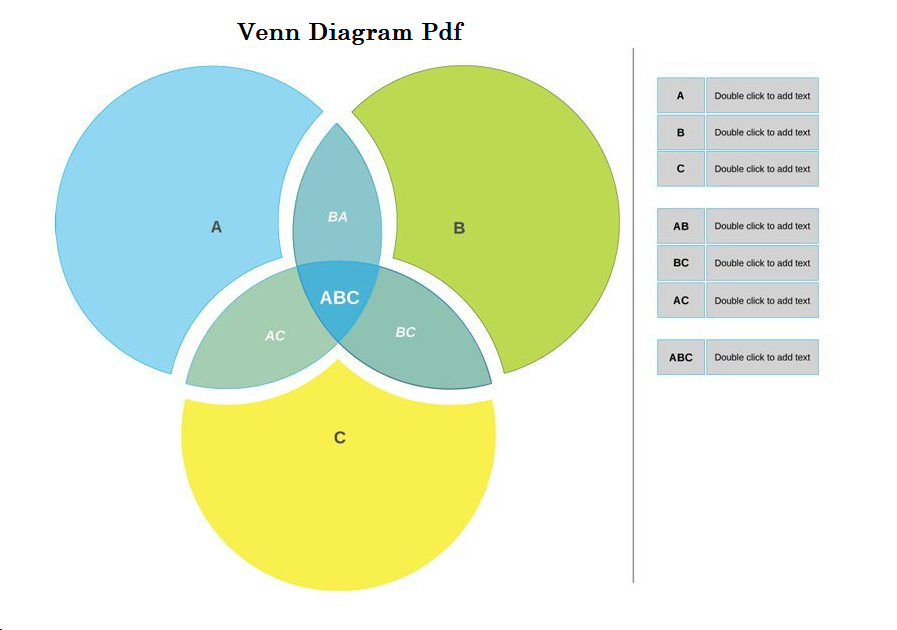
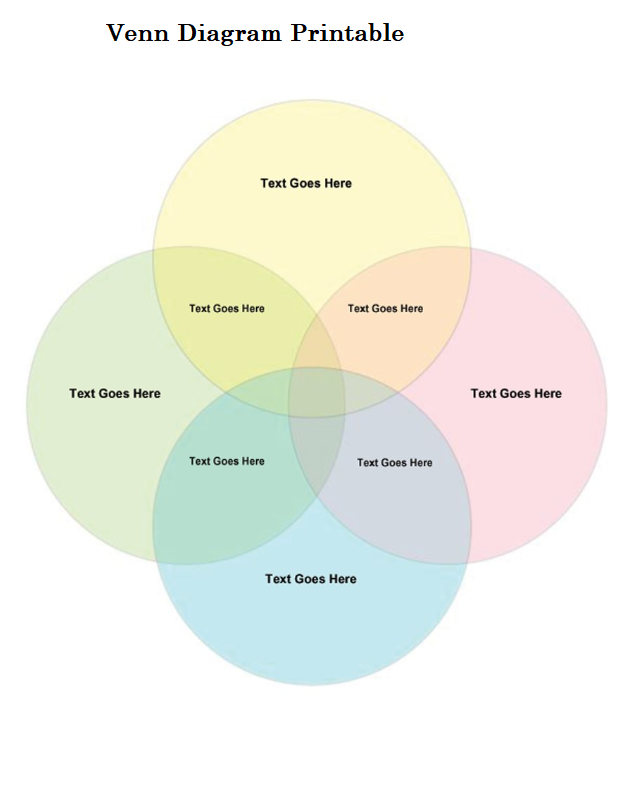
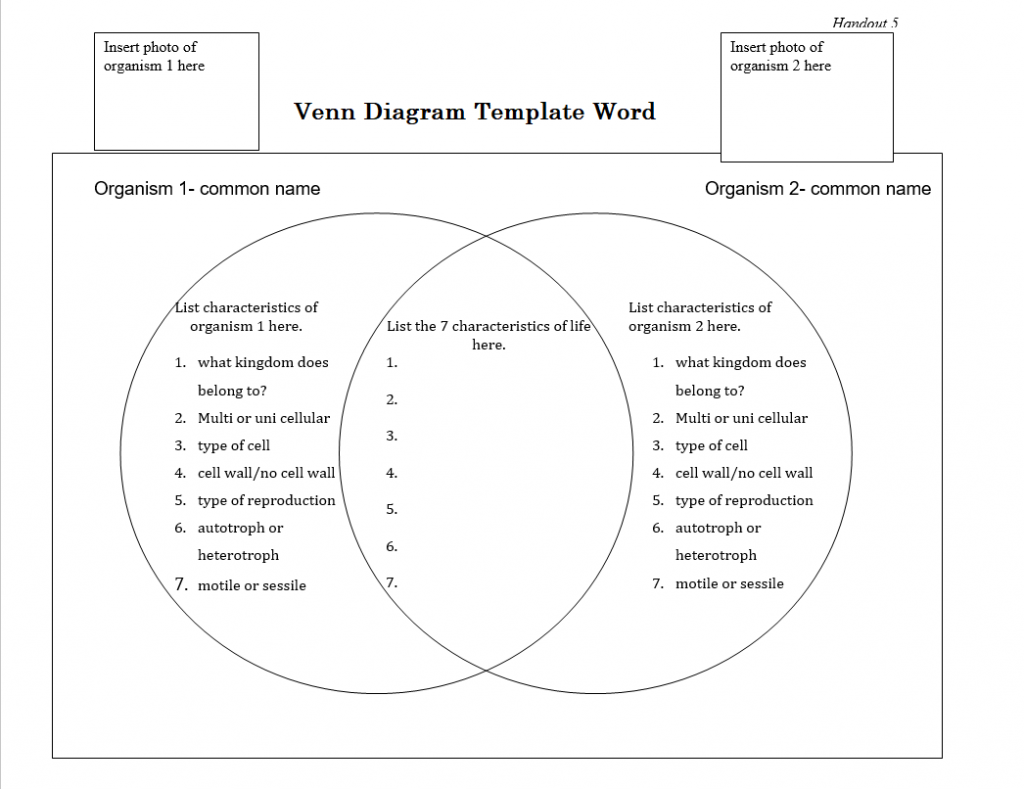
Below Picture Of : Venn diagram templates, 3 circle venn diagram template, venn diagram printable, venn diagrams worksheets, venn diagram excel, venn diagram pdf, venn diagram template word.
Venn Diagram Templates
Venn diagram
Venn diagram excel
Venn Diagram PDF
Venn Diagram Printable
Venn Diagram Templates Word
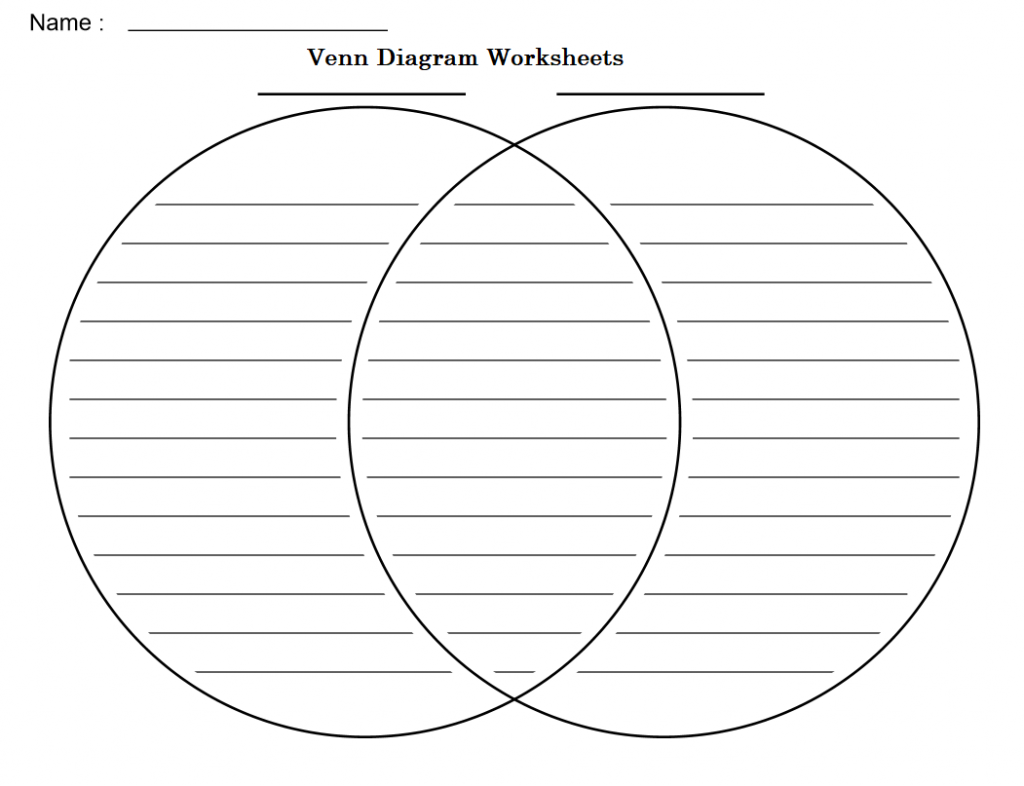
Venn Diagram Worksheets
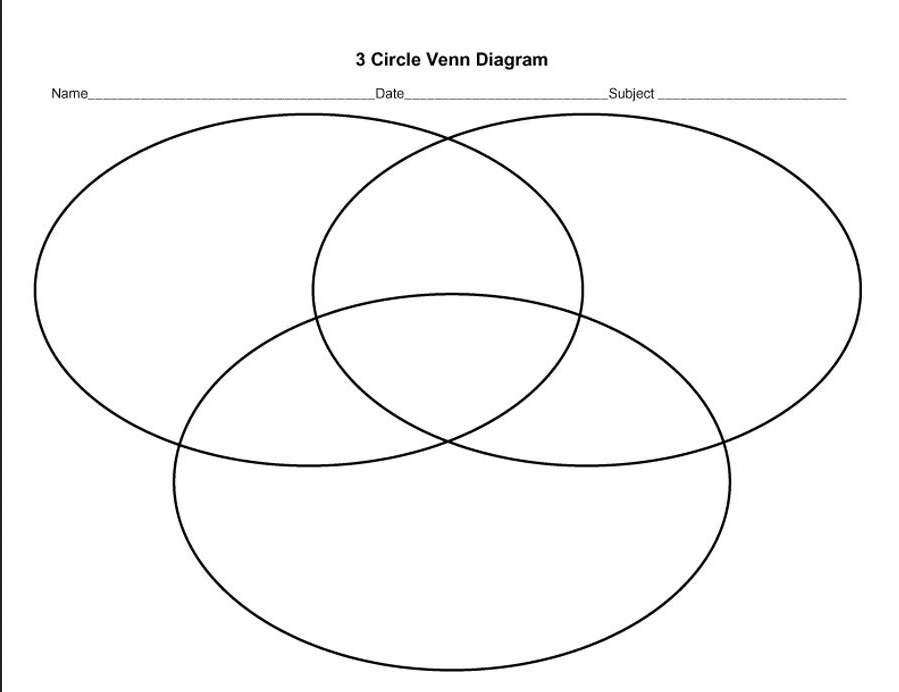
3 Circle Venn Diagram Templates
What are the Benefits?
Venn diagram templates can be useful for a variety of purposes. Some of the benefits of using these templates include:
- Venn diagrams are a visual way to represent information and ideas, making it easier for people to understand and remember the information.
- Venn diagram templates provide a standardized format for creating Venn diagrams, which can help to ensure that the diagrams are clear and easy to read.
- Using a Venn diagram template can save time, as it provides a pre-designed layout that you can use as a starting point for your diagram. This can be especially helpful if you are creating multiple Venn diagrams on the same topic.
- Venn diagram templates can also provide inspiration for new ways to organize and present information, as they often include examples of different types of Venn diagrams and how they can be used.
Overall, using Venn diagram templates can help to make the process of creating Venn diagrams more efficient and effective.
How to Create a Venn Diagram
To create a Venn diagram, follow these steps:
- Identify the two or three sets that you want to compare and contrast. For example, if you want to compare apples and oranges, the sets would be “apples” and “oranges”.
- Draw two or three overlapping circles, with one circle for each set.
- Label each circle with the name of the corresponding set.
- In the area where the circles overlap, write the elements that are shared by all of the sets. For example, if you are comparing apples and oranges, the overlapping area could be labeled “fruit”.
- In the non-overlapping areas of the circles, write the elements that are unique to each set. For example, in the “apples” circle, you could write “red” and “green”, while in the “oranges” circle, you could write “orange” and “yellow”.
- Use arrows or other visual elements to connect the elements in the non-overlapping areas to the corresponding circles. This will help to clarify the relationships between the sets and the elements within them.
- Finally, add a title to the diagram that clearly explains what the Venn diagram is about. This will help to give context to the information and make it easier for others to understand.
How to use the Venn diagram in compare and contrast?
Venn diagrams can be used to compare and contrast two or more things, such as ideas, concepts, objects, or groups of people. To use a Venn diagram for compare and contrast, follow these steps:
Identify the two or more things you want to compare and contrast.
Draw two or three overlapping circles, with one circle for each thing you are comparing.
Label each circle with the name of the corresponding thing.
In the area where the circles overlap, write the characteristics or features that are shared by all of the things you are comparing.
In the non-overlapping areas of the circles, write the characteristics or features that are unique to each thing.
Use arrows or other visual elements to connect the characteristics in the non-overlapping areas to the corresponding circles. This will help to clarify the relationships between the things and the characteristics you are comparing.
Finally, add a title to the diagram that clearly explains what the Venn diagram is about. This will help to give context to the information and make it easier for others to understand.
Here is an example of a Venn diagram comparing apples and oranges:
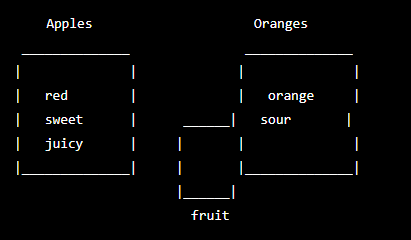
In this Venn diagram, the overlapping area is labeled “fruit”, indicating that both apples and oranges are types of fruit. The non-overlapping areas are labeled with the unique characteristics of each thing, such as the colors and flavors of the apples and oranges. This Venn diagram can help to clarify the similarities and differences between apples and oranges, making it easier to compare and contrast the two.

The content creator team at calipsotree.com is dedicated to making topics accessible to everyone, with over 9 years of experience in writing and breaking down complex concepts into easy-to-understand articles that answer readers’ financial questions.
